Analysis
Overview
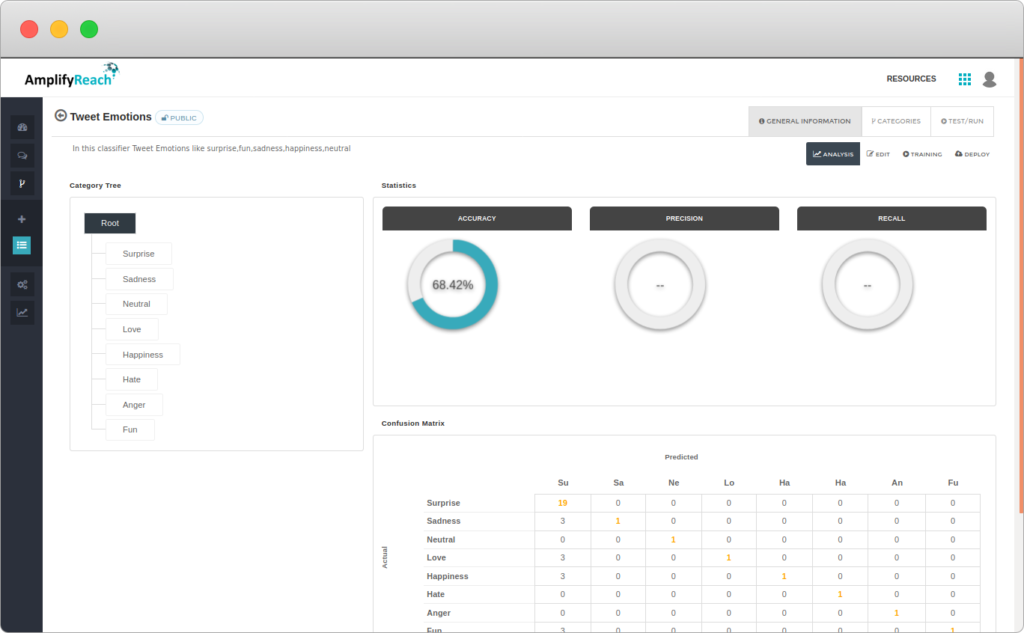
Analysis allows you see all the important parameters governing the classifier. You can Root or individual categories to know the health of the classifier on various parameters.
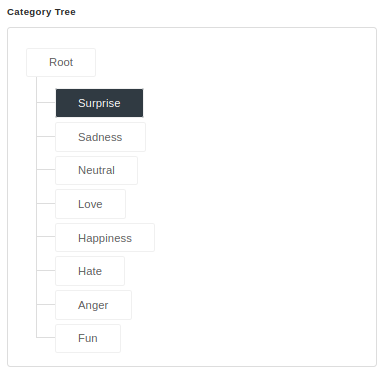
Category Tree
This tree allows you to select Root node or individual category under the classifier. The Statistics and Confusion Matrix provides you critical information on training of your classifier.
Statistics
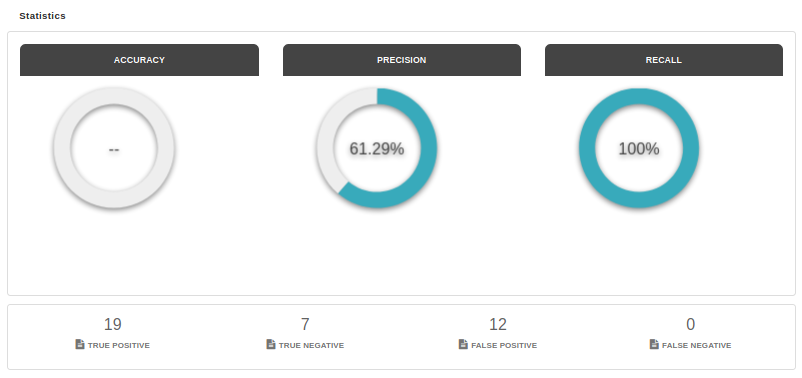
Accuracy
Accuracy is the percentage of correct predictions from total predictions made by the classifier. Note: Accuracy is only shown for non-leaf categories of the category tree.
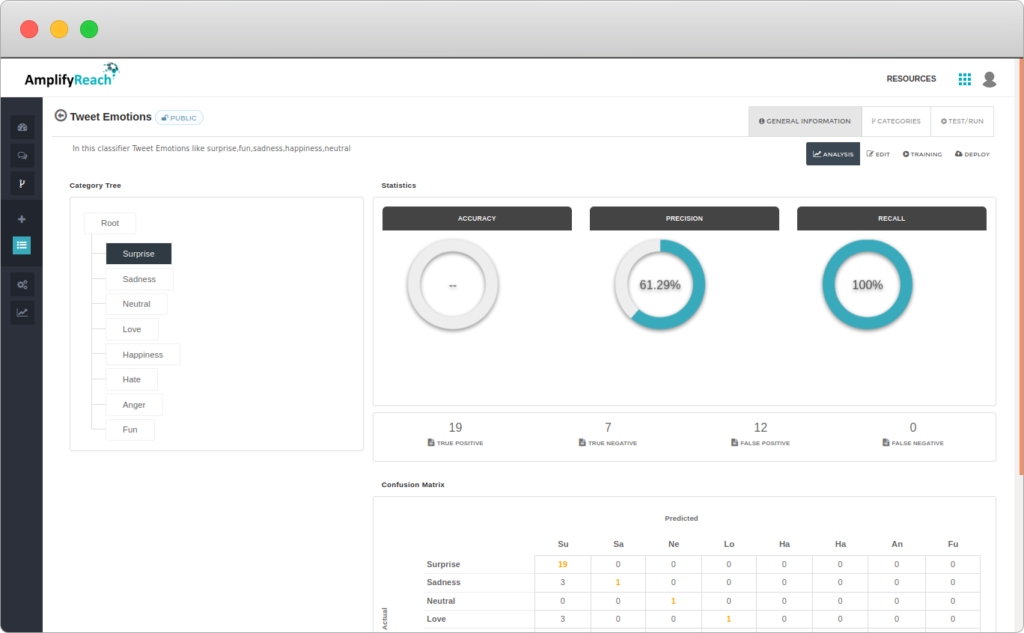
Precision
Precision is the percentage of correct predictions out of the total predictions which fall into this category. Note: Precision and Recall are not shown for Root category.
Recall
Recall is the percentage of correct predictions out of the total test samples of the category.
True Positive
Number of correct predictions for the category.
True Negative
Number of correct negative predictions for the category.
False Positive
Number of incorrect predictions for the category.
False Negative
Number of incorrect negative predictions for the category.
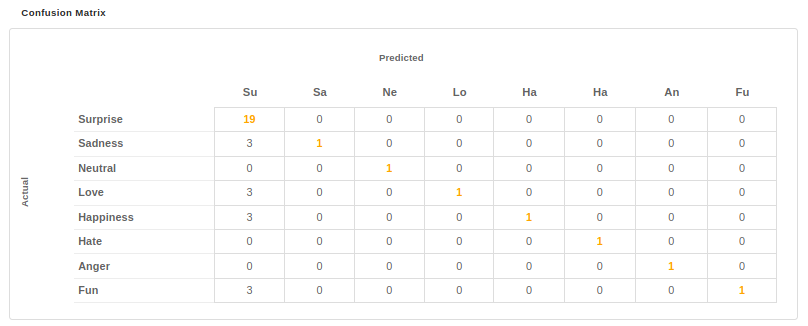
Confusion Matrix
Confusion matrix, also called as Error matrix, allows easy visualization of the performance of your classifier. It’s a two dimensional matrix, where rows represent the actual class, while columns represent the predicted class or vice versa. As diagonal elements represent correct predictions, confusion matrix of an ideal classifier with 100% accuracy will be a diagonal matrix.